The Coil Report — Signals
1 top watch, 6 on the edge, 5 still coiling — in plain English.
🚦 Market check: yellow light
The market's still up but showing cracks. Translation: be patient. Watch the list below, but this isn't a week to chase anything.
SPY $767.83 (50-day $760.91, 200-day $717.61), 9 distribution days.
📐 Sizing framework
The risk ceiling isn't fixed — it moves with the market itself. When the regime is healthy, the ceiling sits at its widest; when distribution days stack up or the tape turns choppy, the same ceiling tightens automatically, so your maximum exposure shrinks right along with the market's own reliability, whether your account is five figures or eight.
📊 Today's regime read
9 distribution days on the tape is a real headwind, and breadth is thin (40% of the universe above its 50-day). Treat tonight's list as a watchlist to build from, not a queue to act on all at once — let the levels do the confirming.
🗺 Sector rotation
Which sectors are actually leading vs SPY — not opinion, just 1-month and 3-month relative strength, ranked.
1. Energy (XLE) — 1M -1.7%, 3M +11.8% vs SPY 2. Technology (XLK) — 1M +7.9%, 3M +2.0% vs SPY 3. Healthcare (XLV) — 1M -3.9%, 3M +5.4% vs SPY 4. Communication Services (XLC) — 1M -0.4%, 3M +0.9% vs SPY 5. Financial Services (XLF) — 1M -6.9%, 3M -3.2% vs SPY 6. Basic Materials (XLB) — 1M -6.8%, 3M -6.5% vs SPY 7. Consumer Defensive (XLP) — 1M -6.3%, 3M -7.1% vs SPY 8. Consumer Cyclical (XLY) — 1M -7.0%, 3M -8.6% vs SPY 9. Industrials (XLI) — 1M -5.5%, 3M -10.3% vs SPY 10. Real Estate (XLRE) — 1M -8.2%, 3M -10.7% vs SPY 11. Utilities (XLU) — 1M -8.6%, 3M -17.4% vs SPY
🔍 Small/mid-cap coverage
The main scan covers 200 mega- and large-cap names. This is a second, curated pass: every session, 934 liquid small- and mid-cap stocks (market cap $300M-$10B, real trading volume, no thin illiquid names) get screened with the same trend template and contraction test. What clears the bar shows up below.
- QMCO (ACTION) — Watch above (pivot) $25.75 · Exit if below (stop) $23.61 · Current price $25.97
- ABUS (SETUP) — Watch above (pivot) $5.23 · Exit if below (stop) $4.80 · Current price $4.85
- ACHV (SETUP) — Watch above (pivot) $8.64 · Exit if below (stop) $7.92 · Current price $7.83
- AGEN (SETUP) — Watch above (pivot) $8.52 · Exit if below (stop) $7.81 · Current price $8.40
- AMC (SETUP) — Watch above (pivot) $2.80 · Exit if below (stop) $2.57 · Current price $2.87
- AMCX (SETUP) — Watch above (pivot) $12.87 · Exit if below (stop) $11.80 · Current price $12.00
- APPS (SETUP) — Watch above (pivot) $12.19 · Exit if below (stop) $11.18 · Current price $11.55
- BGC (SETUP) — Watch above (pivot) $12.51 · Exit if below (stop) $11.47 · Current price $12.10
- BWIN (SETUP) — Watch above (pivot) $32.59 · Exit if below (stop) $29.88 · Current price $31.85
- CDNA (SETUP) — Watch above (pivot) $53.67 · Exit if below (stop) $49.21 · Current price $54.31
- CLOV (SETUP) — Watch above (pivot) $4.64 · Exit if below (stop) $4.25 · Current price $4.57
- CRSR (SETUP) — Watch above (pivot) $13.84 · Exit if below (stop) $12.69 · Current price $13.52
- DBRG (SETUP) — Watch above (pivot) $15.98 · Exit if below (stop) $15.66 · Current price $15.98
- DDD (SETUP) — Watch above (pivot) $3.59 · Exit if below (stop) $3.29 · Current price $3.52
- DV (SETUP) — Watch above (pivot) $13.43 · Exit if below (stop) $12.31 · Current price $13.38
- EGY (SETUP) — Watch above (pivot) $6.12 · Exit if below (stop) $5.61 · Current price $5.84
- GCT (SETUP) — Watch above (pivot) $54.70 · Exit if below (stop) $50.15 · Current price $52.50
- HNGE (SETUP) — Watch above (pivot) $96.66 · Exit if below (stop) $88.62 · Current price $92.33
- HNST (SETUP) — Watch above (pivot) $6.01 · Exit if below (stop) $5.51 · Current price $5.18
- HTFL (SETUP) — Watch above (pivot) $51.78 · Exit if below (stop) $47.47 · Current price $47.39
- IRDM (SETUP) — Watch above (pivot) $49.11 · Exit if below (stop) $45.03 · Current price $48.30
- MG (SETUP) — Watch above (pivot) $20.09 · Exit if below (stop) $18.42 · Current price $20.94
- MRVI (SETUP) — Watch above (pivot) $7.61 · Exit if below (stop) $6.98 · Current price $7.37
- NESR (SETUP) — Watch above (pivot) $35.47 · Exit if below (stop) $32.52 · Current price $32.81
- NMAX (SETUP) — Watch above (pivot) $12.11 · Exit if below (stop) $11.10 · Current price $10.90
- OGN (SETUP) — Watch above (pivot) $13.78 · Exit if below (stop) $12.63 · Current price $13.73
- OPRT (SETUP) — Watch above (pivot) $7.81 · Exit if below (stop) $7.16 · Current price $8.48
- ORIC (SETUP) — Watch above (pivot) $14.00 · Exit if below (stop) $12.84 · Current price $13.33
- PAYO (SETUP) — Watch above (pivot) $7.18 · Exit if below (stop) $6.58 · Current price $7.14
- PBF (SETUP) — Watch above (pivot) $82.61 · Exit if below (stop) $75.74 · Current price $70.47
- PRCH (SETUP) — Watch above (pivot) $17.96 · Exit if below (stop) $16.47 · Current price $16.61
- PSNL (SETUP) — Watch above (pivot) $17.35 · Exit if below (stop) $15.91 · Current price $16.35
- REPL (SETUP) — Watch above (pivot) $16.15 · Exit if below (stop) $14.81 · Current price $12.96
- RNG (SETUP) — Watch above (pivot) $81.90 · Exit if below (stop) $75.09 · Current price $79.26
- RUM (SETUP) — Watch above (pivot) $9.35 · Exit if below (stop) $8.57 · Current price $8.27
- SABR (SETUP) — Watch above (pivot) $2.30 · Exit if below (stop) $2.11 · Current price $2.19
- SGMT (SETUP) — Watch above (pivot) $11.45 · Exit if below (stop) $10.50 · Current price $10.42
- SSRM (SETUP) — Watch above (pivot) $39.44 · Exit if below (stop) $36.16 · Current price $36.30
- STGW (SETUP) — Watch above (pivot) $8.99 · Exit if below (stop) $8.24 · Current price $8.48
- TALO (SETUP) — Watch above (pivot) $18.01 · Exit if below (stop) $16.51 · Current price $16.56
- TH (SETUP) — Watch above (pivot) $21.73 · Exit if below (stop) $19.92 · Current price $21.20
- TRLV (SETUP) — Watch above (pivot) $12.93 · Exit if below (stop) $11.85 · Current price $12.52
- VIR (SETUP) — Watch above (pivot) $11.94 · Exit if below (stop) $10.95 · Current price $11.09
- VRNS (SETUP) — Watch above (pivot) $48.79 · Exit if below (stop) $44.73 · Current price $48.35
- WT (SETUP) — Watch above (pivot) $25.91 · Exit if below (stop) $23.76 · Current price $23.73
- XRX (SETUP) — Watch above (pivot) $3.63 · Exit if below (stop) $3.33 · Current price $3.47
- ZD (SETUP) — Watch above (pivot) $57.68 · Exit if below (stop) $52.88 · Current price $56.75
- ZETA (SETUP) — Watch above (pivot) $32.81 · Exit if below (stop) $30.08 · Current price $29.80
👀 What we're looking for (60 seconds)
Picture someone slowly compressing a spring. That's what every name on this list is doing: its price swings keep getting smaller and trading keeps getting quieter. That combination usually means the sellers are running out. When sellers run dry, even a little buying can send the stock jumping — the spring releases. We can spot a loaded spring; nobody can call the exact day it pops. So we mark the levels that matter and let the stock tell us:
🟢 WATCH ABOVE — the ceiling. The price the stock has bumped its head on over and over. If it finally pushes above this with a rush of buying volume behind it, the spring is releasing. That's the event this whole letter exists to catch.
🔴 EXIT IF BELOW — the floor. The bottom of the recent coil. If price falls below it, the spring was never really loaded. Cross it off and move on. No guessing, no hoping.
These are levels to watch — not instructions to buy or sell anything.
🏷 How to read the grade
Each setup carries a letter from A to F. It scores four things: how confident the contraction pattern reading is, how tight the base actually got, how the stock's strength compares with the rest of the market, and what the underlying business looks like on an earnings-and-sales screen.
The letter is a ranking, not a forecast. It says where a setup stands against everything else the scan surfaced — not what it will do next. An A is roughly the top one in eight; a C covers the broad middle and is the most common grade by some distance; an F is rare and means the setup cleared the entry bar but little else about it is working.
So a C is not a near-miss. It is the middle of the distribution, and plenty of setups the scan is right about live there. Treat the letter as a way to sort your attention when several names qualify at once, not as a prediction about any one of them.
Fundamentals strong / mixed / weak appears next to the letter on each setup. It reports the earnings-and-sales screen for that business, and it is already counted inside the letter — it is shown separately because it is the part of the score you are most likely to want to weigh yourself, not because it is an extra test to add on top. A name can grade well on a tight, clean base while the business underneath it screens weak; seeing both is the point. The full scoring framework is on the methodology page.
🔎 Where these names come from
Every session, the scan covers 200 liquid large- and mid-cap stocks: the S&P 100, the Nasdaq 100, and a hand-picked list of high-momentum growth names, combined and de-duplicated. That's a deliberate choice, not a shortcut — thin, illiquid stocks produce noisy, unreliable contraction patterns, so we trade breadth for quality. It's not the whole market; it's the names worth watching.
🔥 Top watches
These are within 2% of their watch-above level. If they move, they move soon.
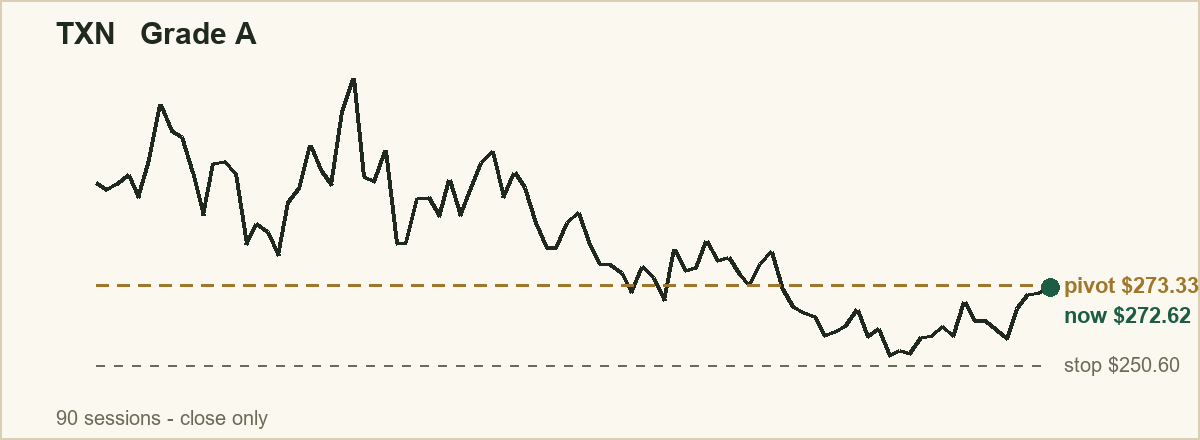
- TXN [Grade A] · Fundamentals strong — Watch above (pivot) $273.33 · Exit if below (stop) $250.60 · Current price $272.62 (distance to trigger 0.3%), risk ceiling 11.7%. A move above $273.33 would confirm the setup is playing out; a drop below the exit level would mean the setup is no longer valid.
- Targets $297.16 / $320.44 / $343.72 (1x, 2x, 3x the risk taken)
- Stop to breakeven $273.88 once it reaches $297.16 · then trail $22.41 below its highest price since entry (2.5x its average daily range)
🫧 On the edge
These poked above their watch-above level today but the buying didn't confirm yet — so we're NOT calling them. This is the discipline: a quiet push over the line doesn't count until the volume backs it. Shown so you can see exactly what we're holding on, and why.
- MRVL [Grade A] · Fundamentals strong — Watch above (pivot) $254.60 · Exit if below (stop) $233.42 · Current price $258.73 (+1.6% over), but only 0.4x volume (wants 2.0x)
- EBAY (eBay) [Grade F] — Watch above (pivot) $107.82 · Exit if below (stop) $100.02 · Current price $109.19 (+1.3% over), but only 0.7x volume (wants 2.0x)
- FAST [Grade D] · Fundamentals mixed — Watch above (pivot) $50.42 · Exit if below (stop) $46.80 · Current price $50.84 (+0.8% over), but only 0.5x volume (wants 2.0x)
- DDOG [Grade F] — Watch above (pivot) $249.91 · Exit if below (stop) $230.57 · Current price $251.25 (+0.5% over), but only 0.5x volume (wants 2.0x)
- DE (John Deere) [Grade F] — Watch above (pivot) $705.88 · Exit if below (stop) $650.56 · Current price $706.44 (+0.1% over), but only 0.9x volume (wants 2.0x)
- BIIB [Grade F] · Fundamentals weak — Watch above (pivot) $225.80 · Exit if below (stop) $207.02 · Current price $227.56 (+0.8% over), but no confirmed volume surge on record
🌀 Still coiling
Winding up, but not near their ceiling yet. Nothing to do — just names to know.
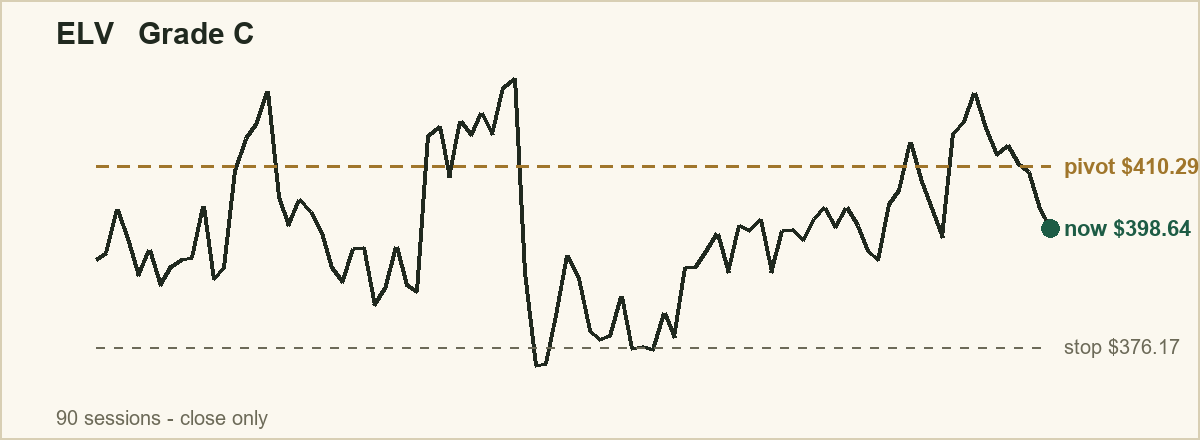
- ELV (Elevance) [Grade C] · Fundamentals mixed — Watch above (pivot) $410.29 · Exit if below (stop) $376.17 · Current price $398.64 (distance to trigger 2.9%)
- Targets $446.05 / $480.99 / $515.93 (1x, 2x, 3x the risk taken)
- Stop to breakeven $411.11 once it reaches $446.05 · then trail $25.90 below its highest price since entry (2.5x its average daily range)
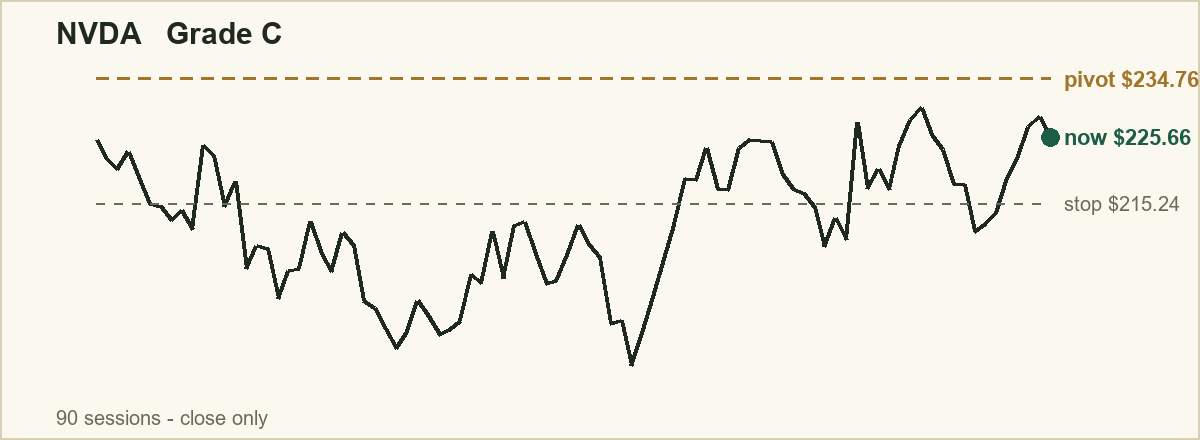
- NVDA [Grade C] · Fundamentals strong — Watch above (pivot) $234.76 · Exit if below (stop) $215.24 · Current price $225.66 (distance to trigger 4.0%)
- Targets $255.22 / $275.21 / $295.20 (1x, 2x, 3x the risk taken)
- Stop to breakeven $235.23 once it reaches $255.22 · then trail $16.02 below its highest price since entry (2.5x its average daily range)
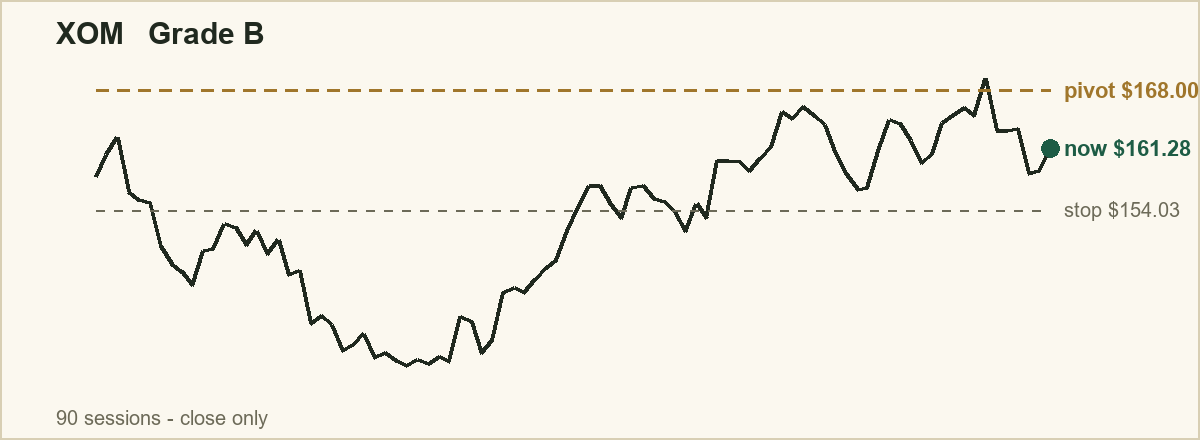
- XOM (Exxon) [Grade B] · Fundamentals strong — Watch above (pivot) $168.00 · Exit if below (stop) $154.03 · Current price $161.28 (distance to trigger 4.2%)
- Targets $182.65 / $196.96 / $211.27 (1x, 2x, 3x the risk taken)
- Stop to breakeven $168.34 once it reaches $182.65 · then trail $9.44 below its highest price since entry (2.5x its average daily range)
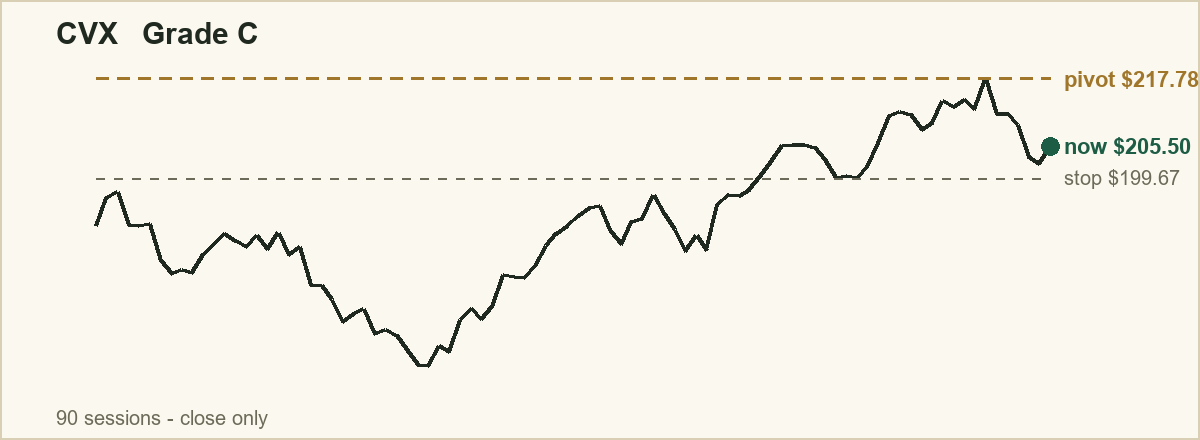
- CVX [Grade C] · Fundamentals strong — Watch above (pivot) $217.78 · Exit if below (stop) $199.67 · Current price $205.50 (distance to trigger 6.0%)
- Targets $236.77 / $255.32 / $273.87 (1x, 2x, 3x the risk taken)
- Stop to breakeven $218.22 once it reaches $236.77 · then trail $11.14 below its highest price since entry (2.5x its average daily range)
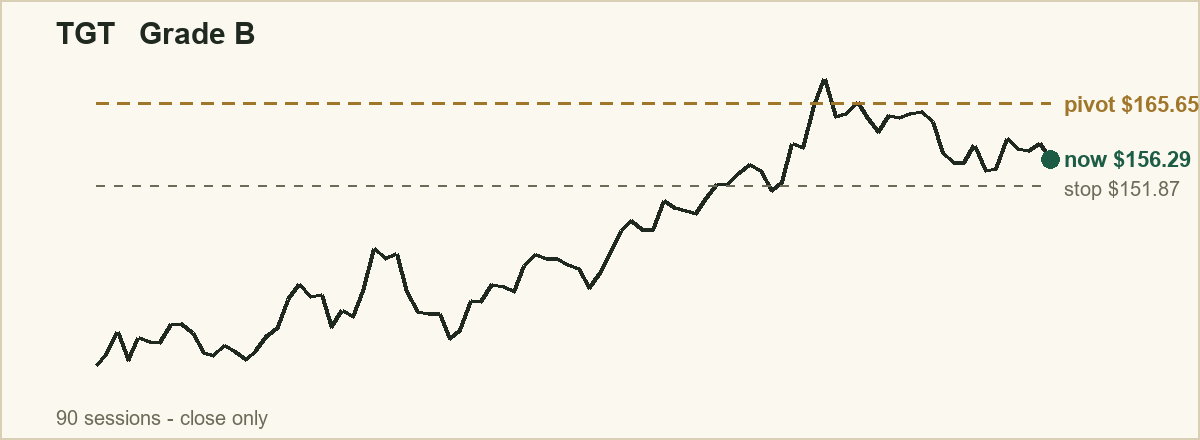
- TGT [Grade B] · Fundamentals strong — Watch above (pivot) $165.65 · Exit if below (stop) $151.87 · Current price $156.29 (distance to trigger 6.0%)
- Targets $180.09 / $194.20 / $208.31 (1x, 2x, 3x the risk taken)
- Stop to breakeven $165.98 once it reaches $180.09 · then trail $10.21 below its highest price since entry (2.5x its average daily range)
🛑 Suppressed
Nothing was held back today. When a setup is suppressed you see it here with the reason, so an empty list means the filter had nothing to catch — not that it stopped reporting.
🎯 Managing the trade
Knowing where to get out if it fails is only the first half of a plan. What you do once a setup is actually working decides most of the outcome, and the worst possible time to invent that rule is while watching it happen. So it gets fixed in advance, in three steps:
1. Nothing moves until the trade has earned what it risked. Your exit stays exactly where the issue printed it. 2. When the gain equals the risk you took, move your exit up to your entry price. Each name above shows the price where that happens. From that point the position can no longer cost you anything. 3. After that, trail your exit below the highest price the stock has reached since you got in. That high-water mark only ratchets upward — if the stock makes a new high the exit follows it up, and if it pulls back the exit stays where it was.
Why the trailing distance is a dollar figure and not a percentage. It is set at about two and a half times the stock's average daily range — how far it typically travels in a session. A quiet stock gets a tight leash and a jumpy one gets a wide leash, so you are only stopped out when a stock does something unusual for itself. A single flat percentage would strangle the first and be useless on the second. The figure moves as the stock's volatility changes, so it is recalculated in every issue a name appears in.
Step 2 is the one people skip, and it is not there to catch a bigger winner. It is there so a position that was up nicely and then rolled over does not hand the whole gain back. These are levels and rules to watch — not instructions to buy or sell anything.
🧠 One thing to remember
A coil doesn't expire. A stock that holds its base through a rough week is often building an even stronger spring. The levels above do the watching for you — check back next issue.
The Coil Report is a financial publication, not an investment adviser. This is impersonal, general-circulation educational commentary — not personalized investment advice, and not a recommendation to buy or sell any security. Trading involves substantial risk; patterns fail regularly. Levels are reference points for your own research. Consult a licensed financial professional before acting. Not affiliated with Mark Minervini, William J. O'Neil, or Investor's Business Daily.